
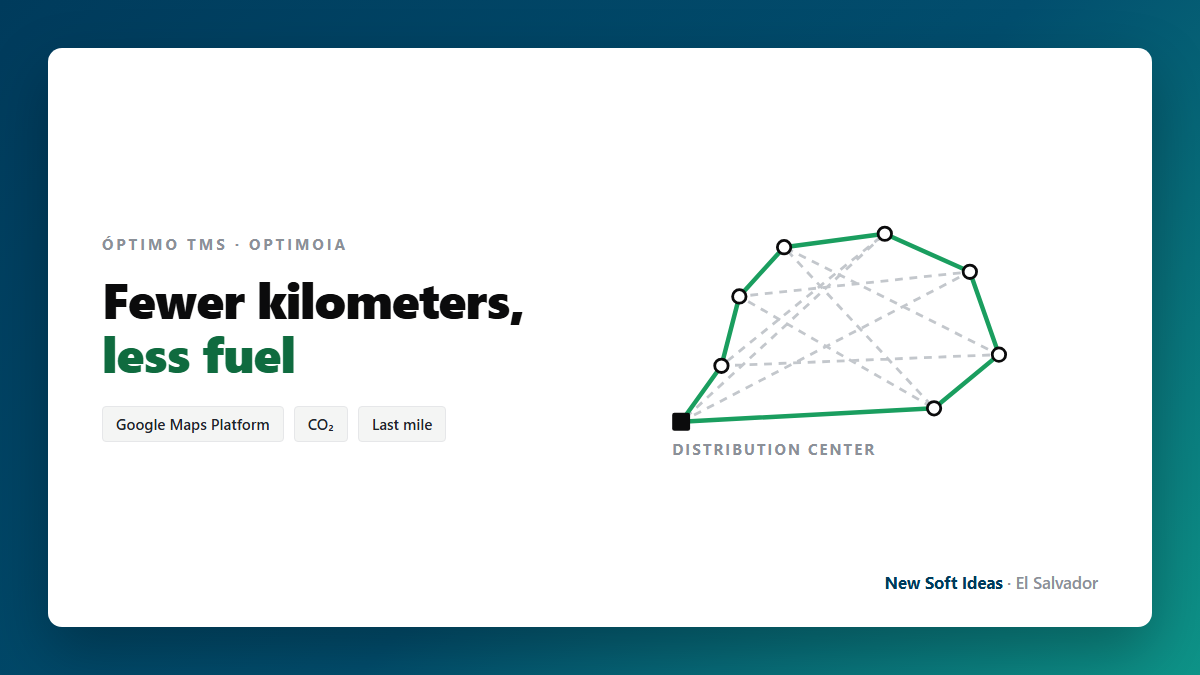
Optimizing delivery is probably the most profitable sustainability decision a logistics operation can make: it cuts cost and footprint with the same move, without changing the fleet or the infrastructure.
Every optimized route is, literally, fuel that never burns.
📄 This article is a summary of our service. The full technical document lives on its own page: Green route optimization service.
The last mile is where fuel gets wasted
Urban delivery concentrates the worst conditions for fuel consumption: heavy vehicles, constant stop-and-go, traffic, and routes usually decided by habit rather than by calculation. A truck that leaves half loaded, a visit sequence with crossings and backtracking, or a delivery that has to be repeated the next day: all of it is paid for twice, in diesel and in emissions.
What we use: three Google Maps Platform engines
We do not estimate straight-line distances: we work over the real road network, with traffic directions, turn restrictions and traffic conditions.
- Route Optimization API — decides how many vehicles go out. It solves the capacitated vehicle routing problem: it receives the distribution center, the geolocated orders with weight and volume, and the available fleet with the real capacity of each unit. It returns which vehicles go out, with what load and in what sequence, respecting the maximum number of stops per shift.
- Directions API — sequences the route. It takes an already assigned delivery run and reorders its destinations by the sequence with the lowest real driving distance and time. This is what removes the crossings and backtracking of a manually built route.
- Distance Matrix API — enables comparison before operating. It calculates point-to-point distances and times so several scenarios can be simulated and the best one chosen before committing the shift.
The optimizer decides; AI explains it
A route nobody understands is a route the supervisor ends up changing by hand — and that is where the savings are lost. That is why every result can come with a plain-language explanation, generated by artificial intelligence over the exact data the optimizer produced.
With three hard rules:
- AI never decides the route. The decision belongs to the optimizer; the AI only narrates it.
- It does not invent figures. It receives the kilometers, minutes and vehicles already calculated, and is explicitly instructed not to add data that is not in the input.
- It never blocks the operation. If the explanation fails, the route is delivered anyway.
Four levers, ranked by what they actually move
- Fewer vehicles on the street (highest impact). By consolidating into a single unit the load that used to be split across several, there are trucks that simply do not go out. A vehicle that does not go out saves one hundred percent of its own fuel.
- Fewer kilometers per delivery. The optimal sequence removes crossings and zigzags. Every liter of diesel not burned is 2.68 kg of CO₂ that is not emitted.
- Less engine running time. The engines optimize driving time, not only distance: less congestion means less idling.
- Fewer failed deliveries. The routes generated are feasible (they respect real capacity and maximum stops) and orders that do not fit are reported instead of forced in. A re-delivery doubles the footprint of that order.
How we calculate the savings
We publish the method before the result. Savings are calculated over the kilometers returned by the optimizer itself and the consumption parameters of each fleet — not over industry averages:
km avoided       = (km manual route − km optimized route)
                 + (vehicles avoided × average route km)

liters avoided   = km avoided × fleet consumption (L/100 km) / 100

kg CO₂ avoided   = liters avoided × fuel factor
| Parameter | Value |
|---|---|
| Diesel — direct combustion | 2.68 kg CO₂/L |
| Gasoline — direct combustion | 2.31 kg CO₂/L |
| Medium delivery truck | 25–35 L/100 km |
| Delivery van | 10–14 L/100 km |
The emission factors come from the GHG Protocol and the DEFRA inventory (scope 1, direct combustion). We prefer to deliver a number each client can audit rather than a generic brochure figure.
Read more
- 📄 Green route optimization service — the full technical document.
- 🚚 How to optimize your delivery routes with a TMS — the module inside Óptimo TMS.
Want to know how much your operation would save? Let's talk about your case and we will calculate it with your fleet's real parameters.